
Define
Approve the reference sample, technical specifications, tolerances and defect classes for each style.
BRANDAI-assisted quality control for apparel brands
Set one quality standard across suppliers. Connect garment images, specifications, AI-assisted findings and human decisions in a traceable workflow.

For brands producing across borders
One standard. Better evidence. Earlier intervention.
01 / THE APPROACH
The brand defines what good looks like. Suppliers capture evidence at agreed production stages. Vision QC AI highlights differences for qualified people to review.
Approve the reference sample, technical specifications, tolerances and defect classes for each style.
BRANDThe supplier provides dated images and identifies the garment, batch and production stage.
SUPPLIERAI-assisted checks flag visible defects, measurement deviations and differences from approved references.
VISION QC AIThe quality team requests a correction, reviews new evidence or chooses a physical inspection.
BRAND02 / THE PLATFORM
The modules connect visual review, garment measurements and approved references to the same inspection record.
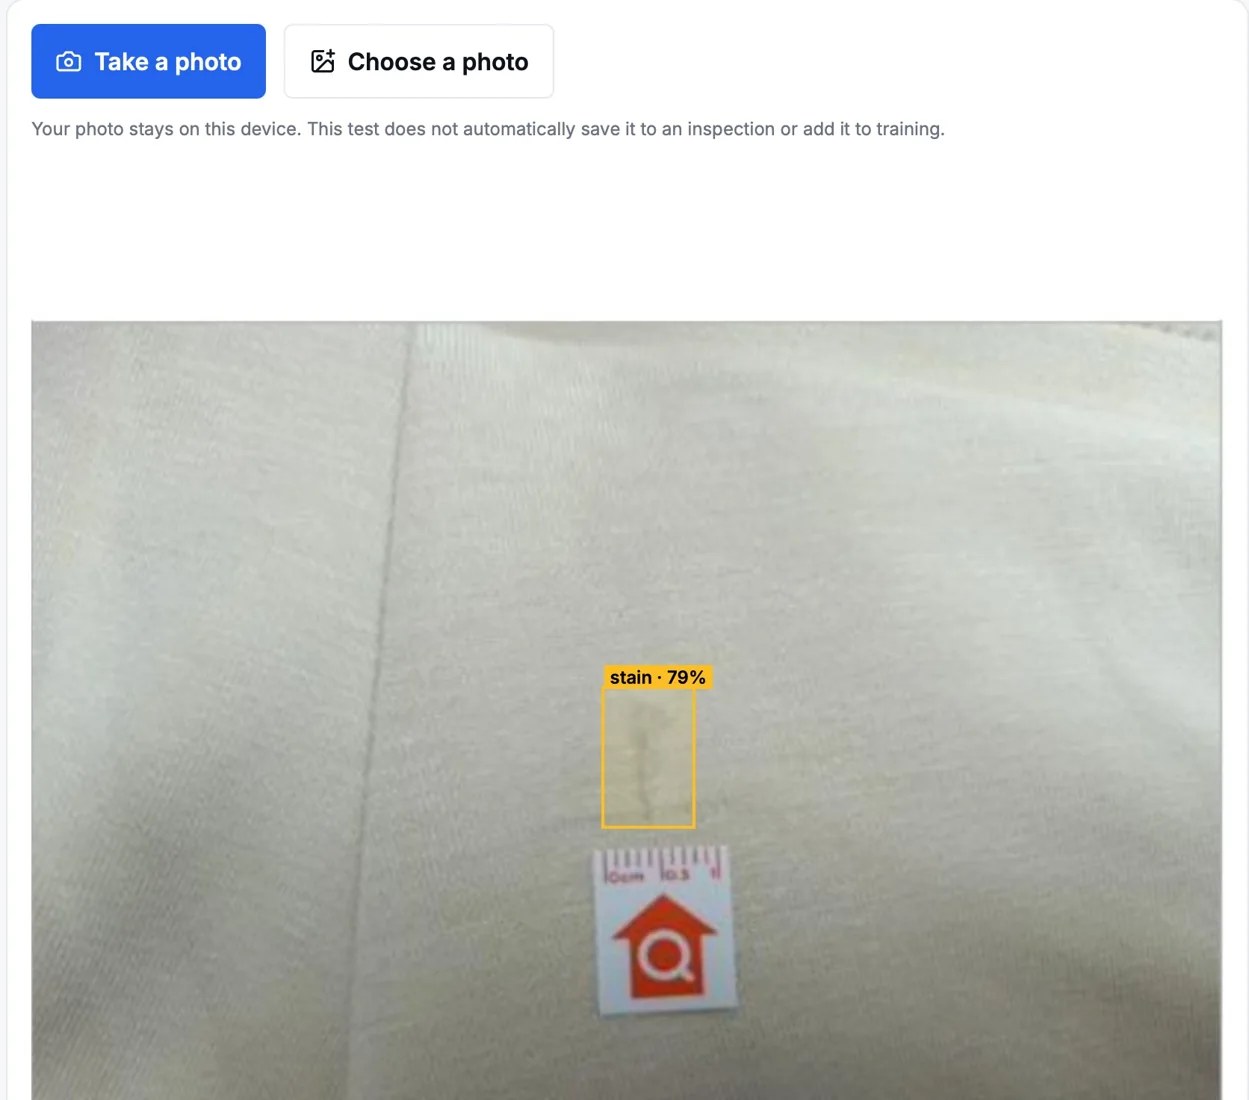 01 / DEFECTS
Highlight areas that need attention, classify them by type, location and severity, and keep the reviewer in control of the decision.
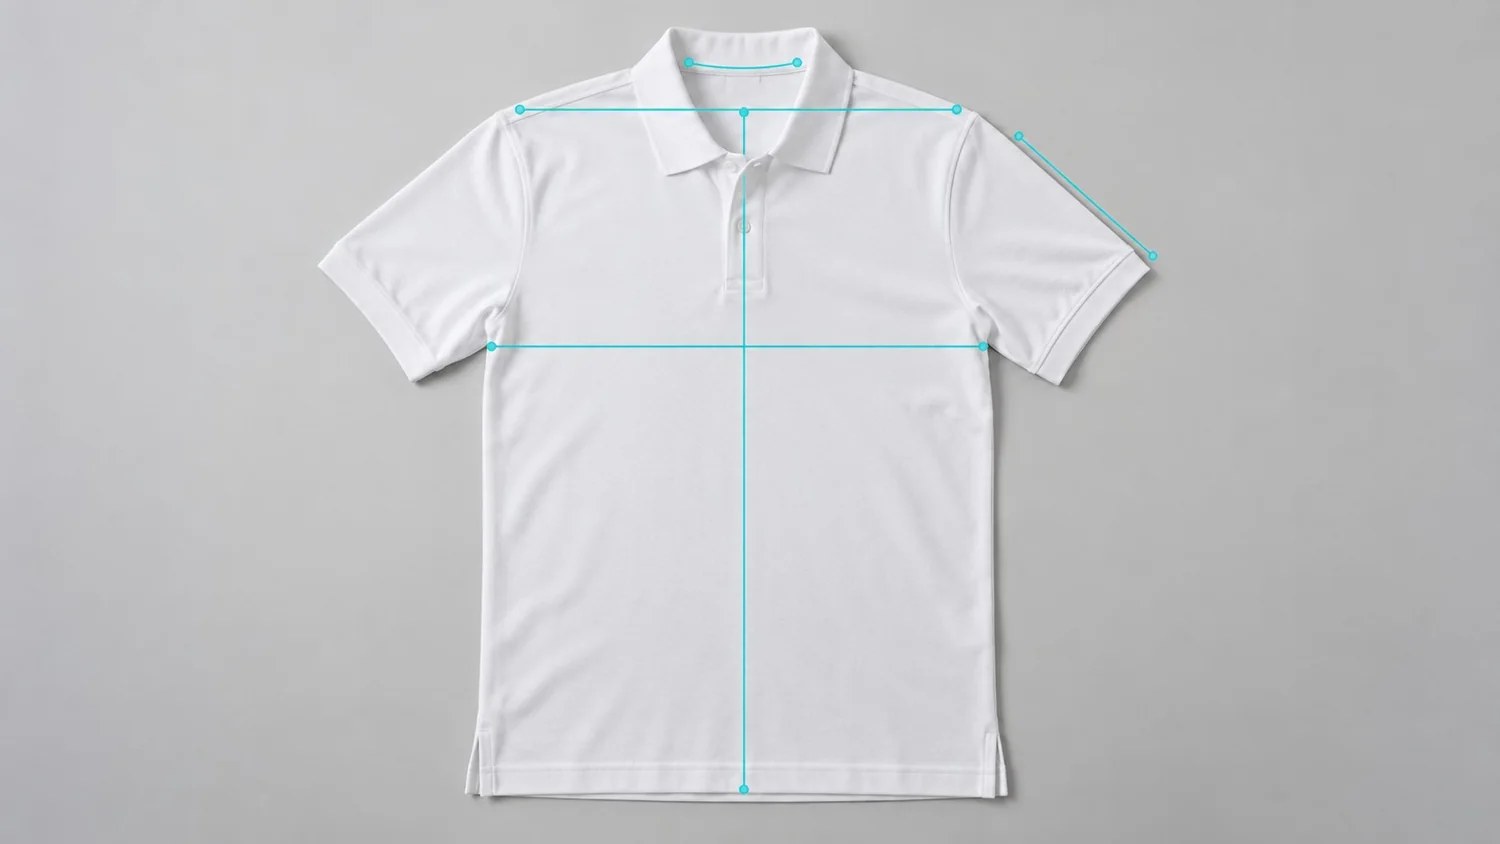 02 / MEASUREMENTS
Use a style and size template to compare measurement points with approved specifications and flag out-of-tolerance results.
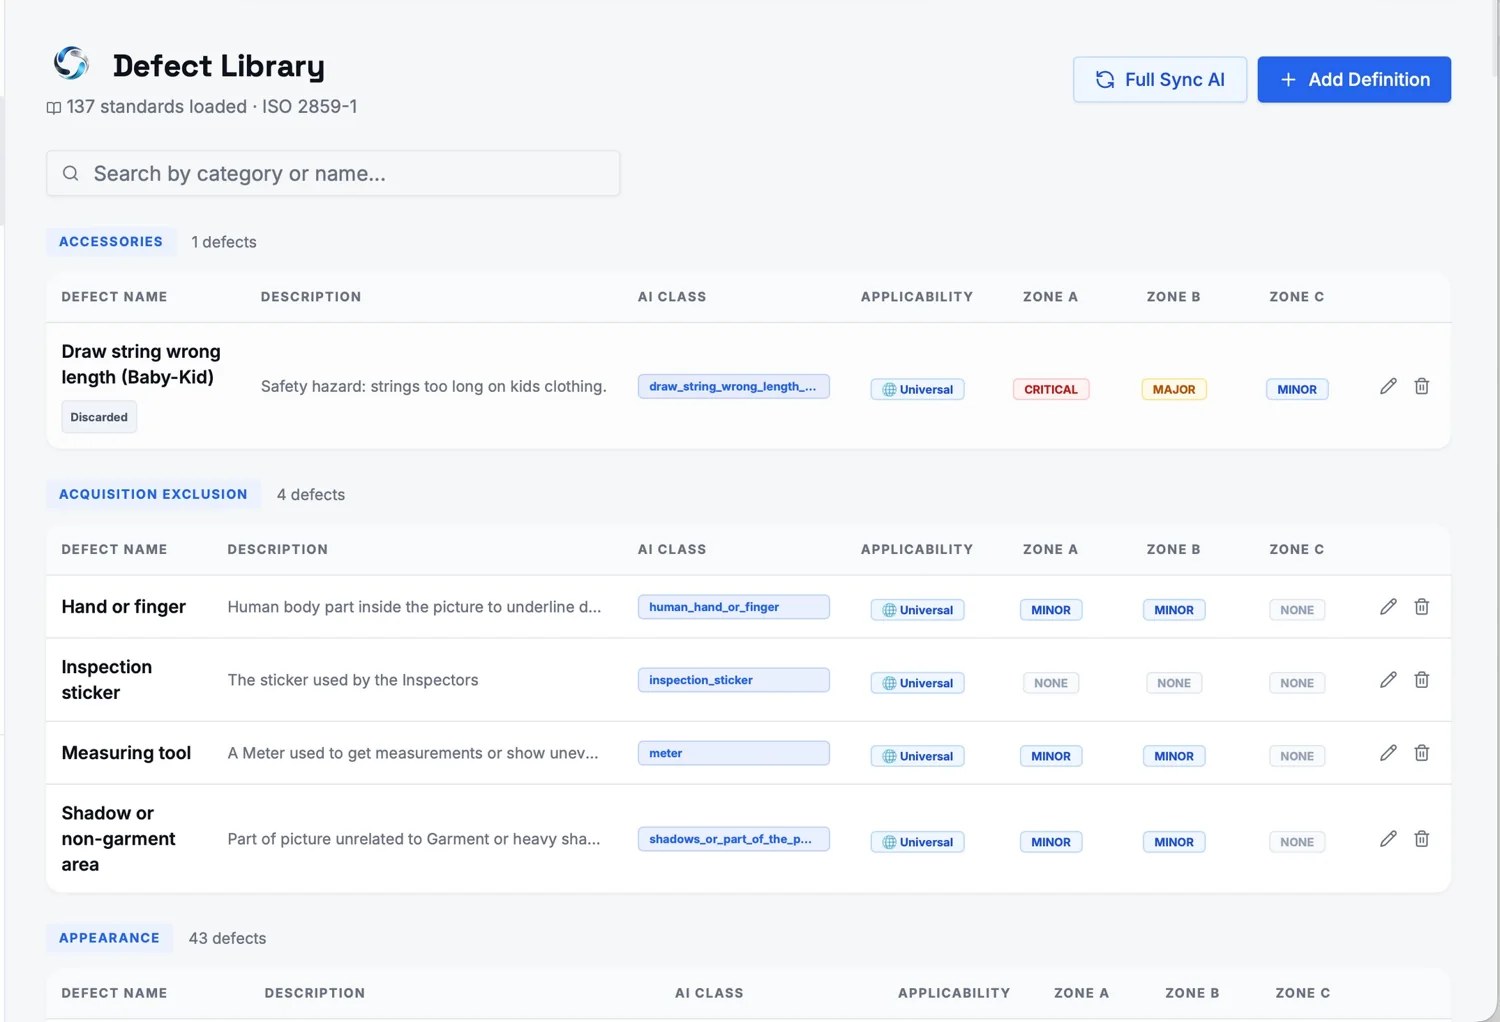 03 / COMPARISON
Shared defect classes, references and review rules help teams compare production evidence across suppliers and batches.
Illustrative examples from the project presentation; capabilities and performance are confirmed in the customer's production workflow.
03 / ECONOMIC IMPACT
The quality programme compares the full cost of inspection against a like-for-like baseline agreed with the customer. Results are reviewed on real products and batches.
Supplier quality teams work on site while external inspections focus on critical issues. The guarantee is assessed against an agreed cost baseline and equivalent inspection scope.
Proposed cost index composition
Method. Cost index 100 represents the customer's present cost per comparable lot. The 50-point programme target and 20/15/15 composition follow the supplied Vision QC AI study. Actual scope, baseline and results are established for each customer; peak savings depend on how quality control is organised.
04 / REVIEW & ACCOUNTABILITY
Each finding can connect the garment and lot to original images, references, tolerances, a proposed severity and the brand's review outcome. Teams can track corrections without losing the history of what was seen.
05 / FUTURE DEVELOPMENT
DEVELOPMENT CONCEPTThe planned inspection machine extends the software workflow to controlled imaging, automated handling and higher visual coverage. It is a future development project, with cycle times and costs to be validated on an operating line.
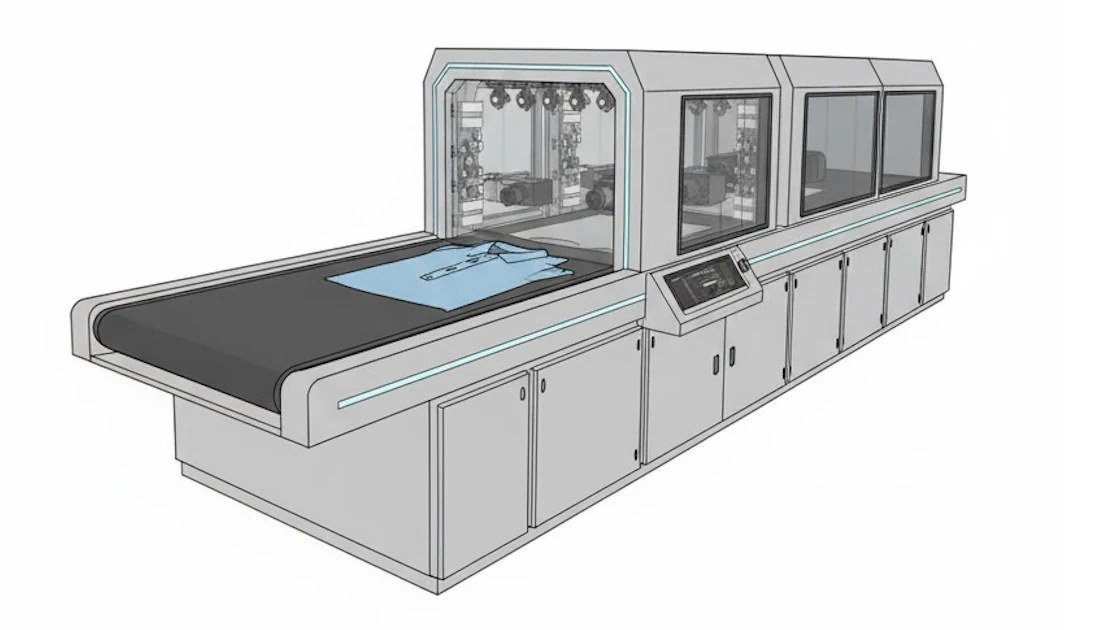 CONCEPT IMAGE / NOT A RELEASED PRODUCT
With 250 operating days and a $120 daily labour cost in the study, the model compares manual inspection with assisted inspection. Equipment purchase and installation are outside these operating figures.
$328k estimated annual operating cost difference
Source: Vision QC AI garment-line study scenario. These are modelled figures for a future machine, not observed customer results. Throughput, downtime, cost and visual coverage require validation on site.
06 / START WITH EVIDENCE
A demonstration and structured evaluation put the platform against the products, suppliers and quality criteria that matter to your business.
Review software, defect examples, measurements and reports with your quality and production teams.
Compare AI-assisted findings with expert checks on the same garments and agreed production stages.
Assess total cost per lot, accuracy, coverage, turnaround and evidence traceability.
Define the operational programme and commercial terms once the results meet your criteria.
07 / PRESENTATIONS
Product presentations and technical material will be published here when the public editions are ready. To send or request material, email support@visionnova.tech.
No files are publicly available yet.
LET'S TALK QUALITY
Arrange a demonstration with your quality and production teams.